U.S. News
- U.S. Retail Sales
- Sales at retailers rose 0.7% in March after economists forecasted a smaller 0.3% increase
- Sales minus auto and gas rose 1.0%
- Internet retail sales rose 2.7%, with online retailers benefiting from the Easter holiday falling in March this year
- Existing Home Sales
- Existing home sales fell 4.3% to an annual rate of 4.19 million in March
- The median sales price was $393,500 in March, down from its peak at $413,800 in June of 2022
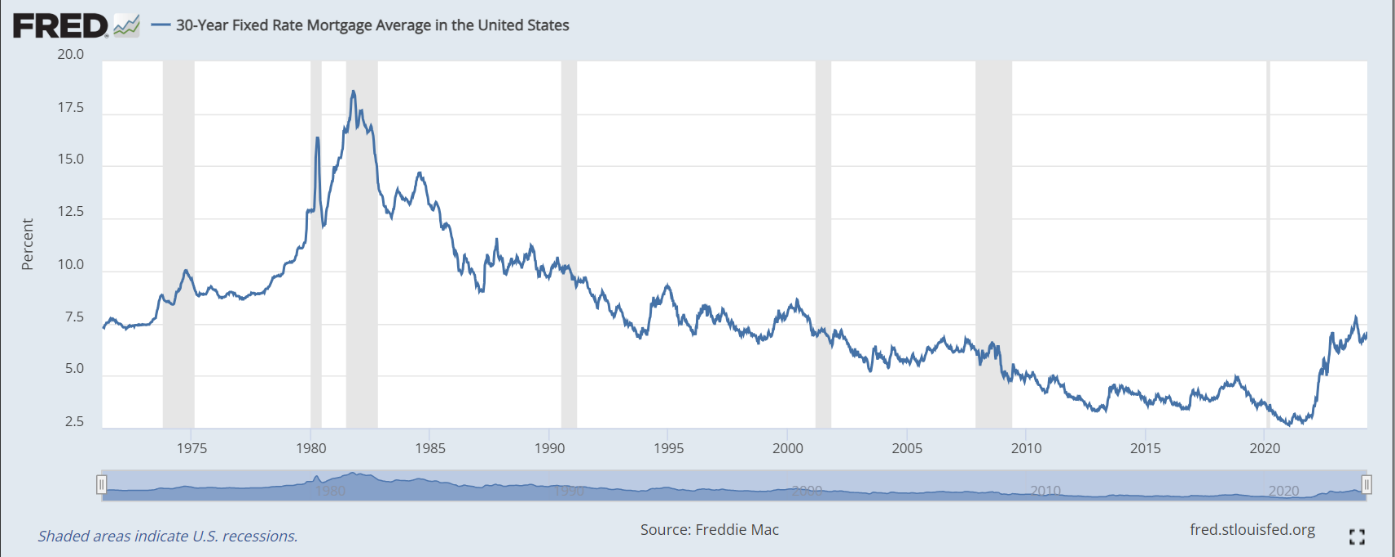
- The dip in sales is primarily due to the average rate of the 30-year mortgage jumping a quarter percentage point to 7.1%. Additionally, home buyers are confused about the coming changes to how real estate agents are compensated
- Housing Starts
- Construction of new homes fell 14.7% in March as home builders scaled back new projects
- Housing starts fell to a 1.32 million annual pase from a 1.55 million pace in February
- The drop in March was the sharpest since April 2020, when starts dropped by 27%
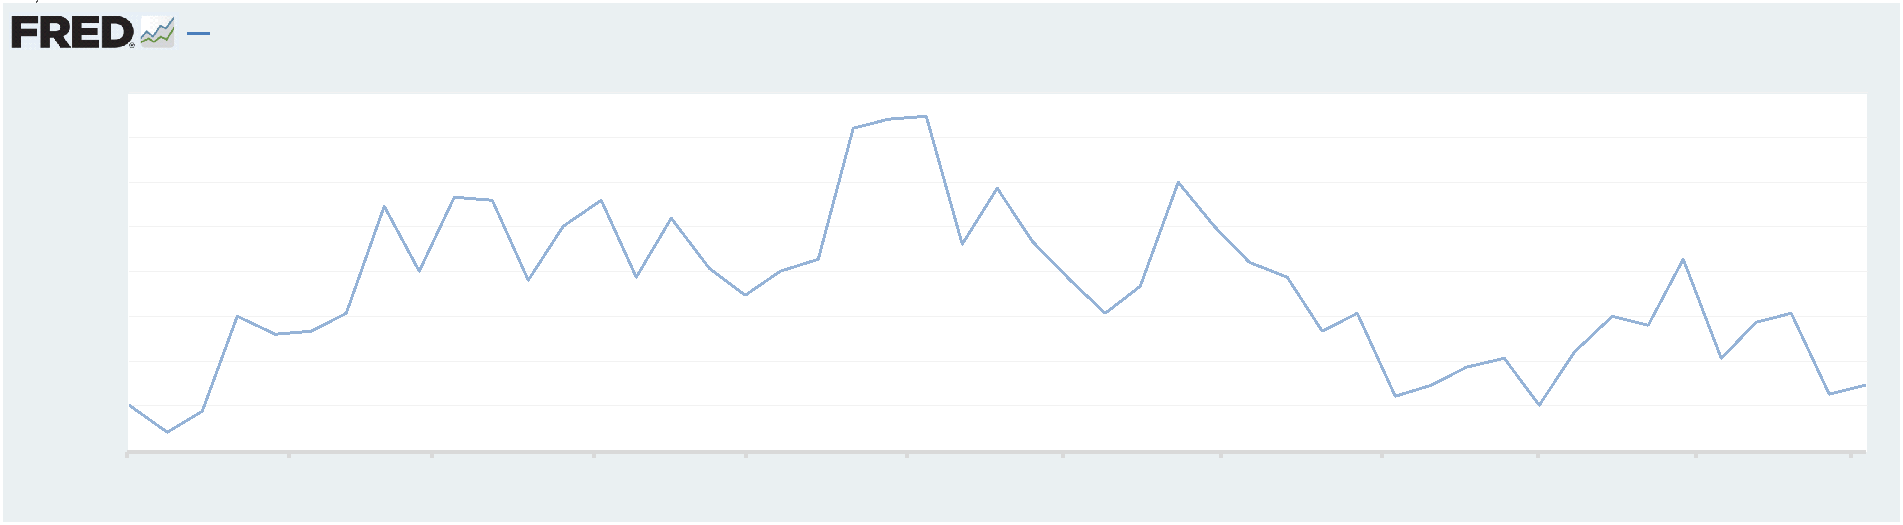
- Jobless Claims
- Initial jobless claims, a measure of how many workers were laid off across the U.S., decreased to 212,000 in the week ended April 12, down 12,000 from the prior week
- The four-week moving average was 214,500, down 8500 from the prior week
- Continuing claims – those filed by workers unemployed for longer than a week – increased by 2,000 to 1.812 million in the week ended April 5. This figure is reported with a one-week lag
- Fed’s Balance Sheet
- The Federal Reserve’s assets totaled $7.406 trillion in the week ended April 19, down $32.7 billion from the prior week
- Treasury holdings totaled $4.560 trillion, down $15.3 billion from the prior week
- Holdings of mortgage-backed securities (MBS) were $2.39 trillion in the week, down $0.2 billion from the prior week
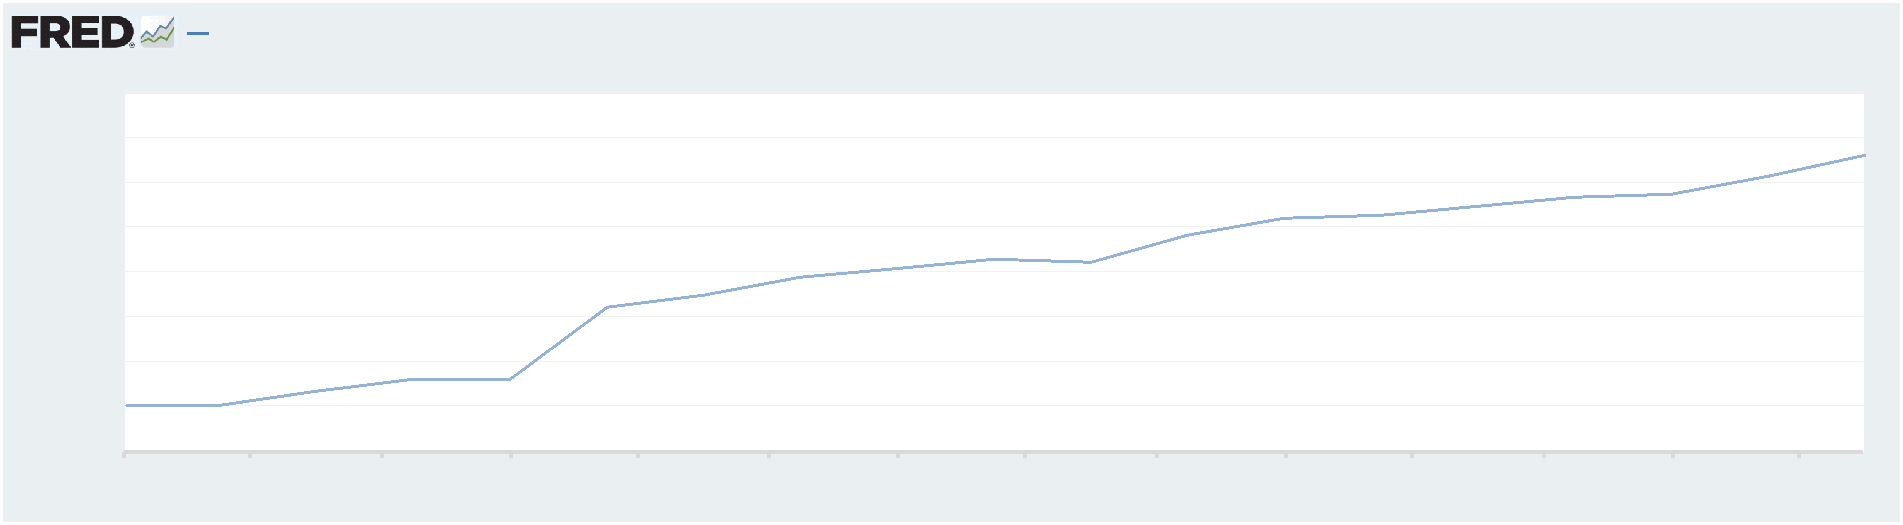
- Total Public Debt
- Total public debt outstanding was $34.58 trillion as of April 19, an increase of 9.9% from the previous year
- Debt held by the public was $24.63 trillion, and intragovernmental holdings were $7.08 trillion
- Inflation Factors
- CPI:
- The consumer-price index rose 3.5% in March year over year
- On a monthly basis, the CPI increased 0.4% in March on a seasonally adjusted basis, after increasing 0.4% in February
- The index for all items less food and energy (core CPI) rose 0.4% in March, after rising 0.4% in February
- Core CPI increased 3.8% for the 12 months ending March
- Food and Beverages:
- The food at home index increased 1.2% in March from the same month a year earlier, and decreased 0.0% in March month over month
- The food away from home index increased 4.2% in March from the same month a year earlier, and increased 0.3% in March month over month
- Commodities:
- The energy commodities index increased 1.5% in March after increasing 3.6%
- The energy commodities index fell 0.9% over the last 12 months
- The energy services index (0.0%) in March after increasing 0.1% in February
- The energy services index rose 3.1% over the last 12 months
- The gasoline index fell 1.3% over the last 12 months
- The fuel oil index fell (3.7%) over the last 12 months
- The index for electricity rose 5.0% over the last 12 months
- The index for natural gas fell (3.2%) over the last 12 months
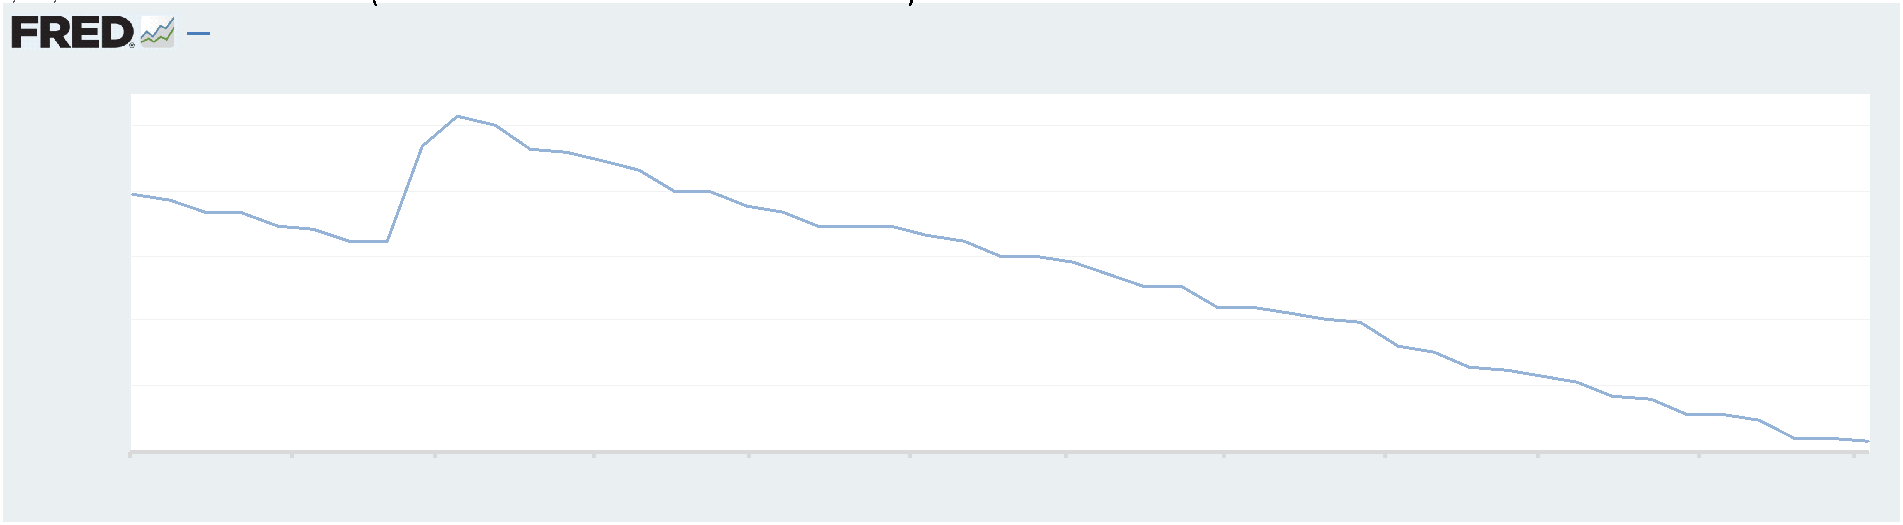
- Supply Chain:
- Drewry’s composite World Container Index decreased to $2,718.54 per 40ft
- Drewry’s composite World Container Index has increased by 53.3% over the last 12 months
- Housing Market:
- The shelter index increased 0.4% in March after increasing 0.4% in February
- The rent index increased 0.5% in March after increasing 0.4% in February
- The index for lodging away from home increased 5.6% in March after increasing 3.1% in February
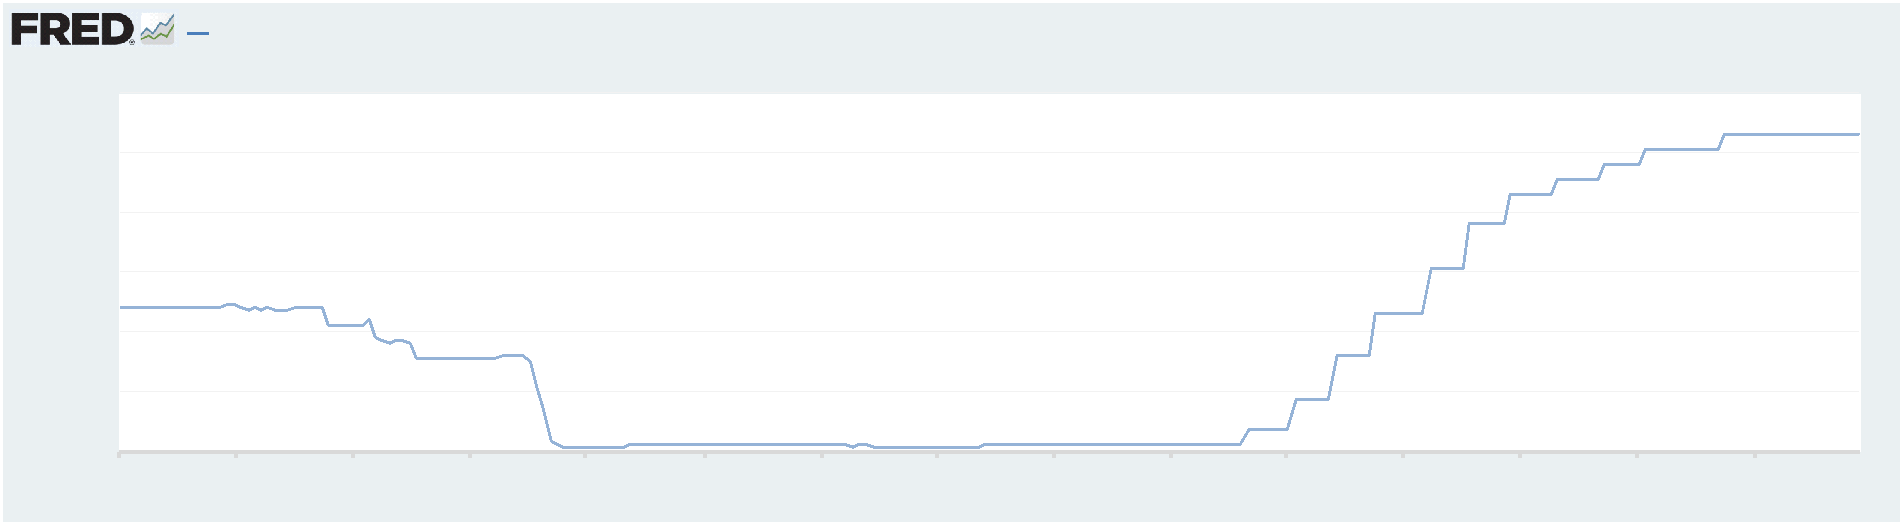
- Federal Funds Rate
- The effective Federal Funds Rate is at 5.33%, flat 0.00% year to date
World News
-
Israel
- On Friday, Israel launched a retaliatory strike against Iran after the massive drone and missile attacks on Israel’s territory
- The strike targeted the area around Isfahan in central Iran. The city is where Iran has nuclear facilities and an air base. The move has been seen as a moderate response, and Israel has been under pressure from the U.S. and Europe to calm tensions that the Iran attack would grow into a bigger regional conflict
- Iran state television played down the strike on its broadcasts, a move seen as an effort to calm tensions
-
China
- China added a 43.5% tax on imports from the U.S. for U.S. made propionic acid after an investigation revealed that the chemical was sold in China at rock-bottom prices and hurting Chinese producers. The two U.S. companies accused of the low pricing are Dow and Eastman Chemical
- The tariff comes just days after President Biden called for higher tariffs on Chinese steel and the U.S. began anti-dumping problems centered on China’s shipbuilding, maritime and logistics industries. China has an excess supply of unsold metal as a result of China’s property bust
- China is ordering Apple to remove WhatsApp and Threads from the Apple store due to national security concerns, which is the latest example of censorship in the country
-
India
- Incumbent Prime Minister Modi is vying for a third term in office this spring. Modi has been in office since 2014
- The election will last six weeks and be administered by over 15 million poll workers. There are over 960 million people eligible to vote
- Since entering office, Prime Minister Modi’s administration has upgraded the transportation network, built new power plants, and subsidized the construction of 40 million concrete homes
-
Niger
- Niger has ordered the U.S. to withdraw troops and drones from the country, a move that will significantly curtail American strategy to defeat Islamist insurgency in western Africa
-
Italy
- An explosion at a hydroelectric power plant owned by Rome-based energy group Enel killed at least three people. The explosion was likely caused by a fire in a turbine or a transformer at the plant
-
Germany
- Germany’s industrial production rose more than expected in February, helped by a recovery in the construction and car industry, as the country looks to exit a recent manufacturing slump
-
Canada
- Canada’s goods-trade surplus widened more than expected, driven by record gold shipments and marking the strongest export growth in six months
-
South Korea
- South Korea’s exports grew for a sixth consecutive month, driven by strong demand for semiconductors and ships, with a 3.1% increase from the previous year to $56.56 billion
-
Taiwan
- A magnitude-7.4 earthquake, the strongest to hit Taiwan in 25 years, killed at least nine people, injured more than 900, and caused significant structural damage including the collapse of buildings
-
Japan
- The Bank of Japan ended negative interest rates and unwound most of its unconventional monetary easing policies, moving its key target for short-term rates to a range of 0% to 0.1%, its first rate increase since 2007
Commodities
-
Oil Prices
- WTI: $83.14 per barrel
- (2.94%) WoW; +16.04% YTD; +7.57% YoY
- Brent: $87.36 per barrel
- (3.42%) WoW; +13.40% YTD; +7.72% YoY
-
US Production
- U.S. oil production amounted to 13.1 million bpd for the week ended April 12, up 0.8 million bpd
from the prior week
-
Rig Count
- The total number of oil rigs amounted to 619, up 2 from last week
-
Inventories
-
Crude Oil
- Total U.S. crude oil inventories now amount to 460.0 million barrels, down (1.3%) YoY
- Refiners operated at a capacity utilization rate of 88.1% for the week, down from 88.3% in the prior week
- U.S. crude oil imports now amount to 6.434 million barrels per day, down 2.7% YoY
-
Gasoline
- Retail average regular gasoline prices amounted to $3.68 per gallon in the week of April 19,
down (0.1%) YoY
- Gasoline prices on the East Coast amounted to $3.56, down (1.5%) YoY
- Gasoline prices in the Midwest amounted to $3.54, down (3.2%) YoY
- Gasoline prices on the Gulf Coast amounted to $3.27, down (4.6%) YoY
- Gasoline prices in the Rocky Mountain region amounted to $3.55, down (2.7%) YoY
- Gasoline prices on the West Coast amounted to $4.98, up 7.6% YoY
- Motor gasoline inventories were down by 1.2 million barrels from the prior week
- Motor gasoline inventories amounted to 227.4 million barrels, up 1.7% YoY
- Production of motor gasoline averaged 9.42 million bpd, down (0.6%) YoY
- Demand for motor gasoline amounted to 8.662 million bpd, up 1.7% YoY
-
Distillates
- Distillate inventories decreased by -2.8 million in the week of April 19
- Total distillate inventories amounted to 115.0 million barrels, up 2.6% YoY
- Distillate production averaged 4.601 million bpd, down (3.1%) YoY
- Demand for distillates averaged 3.666 million bpd in the week, down (2.6%) YoY
-
Natural Gas
- Natural gas inventories increased by 50 billion cubic feet last week
- Total natural gas inventories now amount to 2,333 billion cubic feet, up 20.9% YoY
Credit News
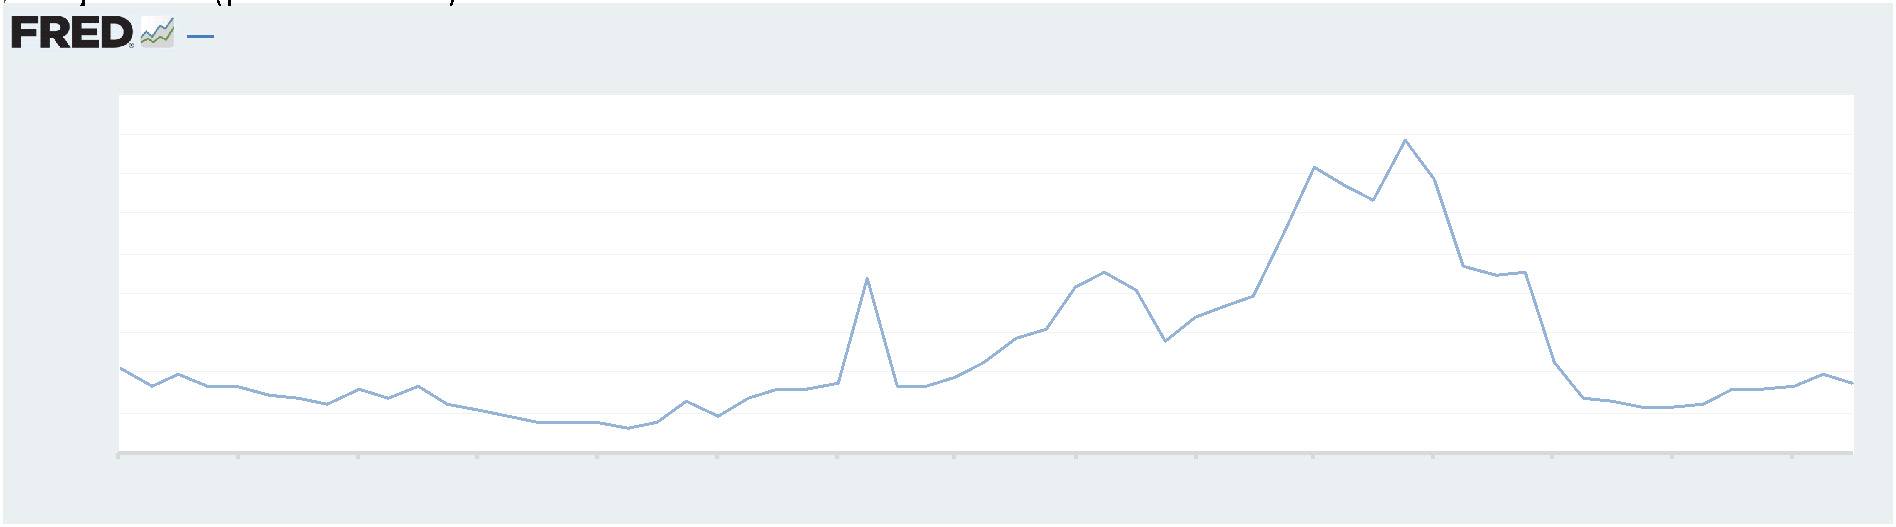
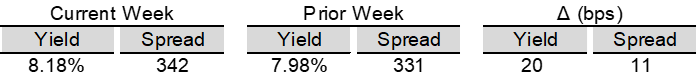
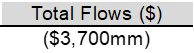
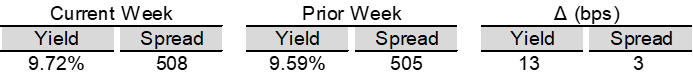
High yield bond yields increased 20bps to 8.18% and spreads increased 11bps to 342bps. Leveraged loan yields increased 13bps to 9.72% and spreads increased 3bps to 508bps. WTD Leveraged loan returns were positive 7bps. WTD high yield bond returns were negative 53bps. 10yr treasury yields increased 7bps to 4.64%. For the week, yields and spreads rose amid resurfacing geopolitical tensions coupled with the highest VIX since October, steady equity market losses, and higher Treasury yields in response to recalibrated Fed expectations.
High-yield:
Week ended 04/19/2024
- Yields & Spreads1
- Pricing & Returns1

- Fund Flows2
- New Issue2

- Distressed Level (trading in excess of 1,000 bps)2

- Total HY Defaults

1 Source: Credit Suisse High Yield and Leveraged Loan Index
2 Source: JP Morgan
Leveraged loans:
Week ended 04/19/2024
- Yields & Spreads1
- Leveraged Loan Index1

- Fund Flows2
- New Issue2

- Distressed Level (loan price below $80)1

- Total Loan Defaults

Default activity:
- Most recent defaults include: JoAnn Stores ($658mn, 3/18/24), New Insight Holdings ($1.2bn, 3/13/24), Robertshaw ($820mn, 2/29/24), Thrasio LLC ($724mn, 2/28/24), Hornblower ($838mn, 2/20/24), Careismatic ($700mn, 1/22/24), Enviva Partners ($750mn, 1/15/24), Ligado Networks ($4.2bn, 11/1/23), and Air Methods ($1.7bn, 10/24/23).
CLOs:
Week ended 04/19/2024
- New U.S. CLO Issuance2

- New U.S. CLO Issuance2

Note:High-yield and leveraged loan yields and spreads are swap-adjusted
1 Source: Credit Suisse High Yield and Leveraged Loan Index
2 Source: JP Morgan
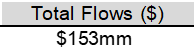
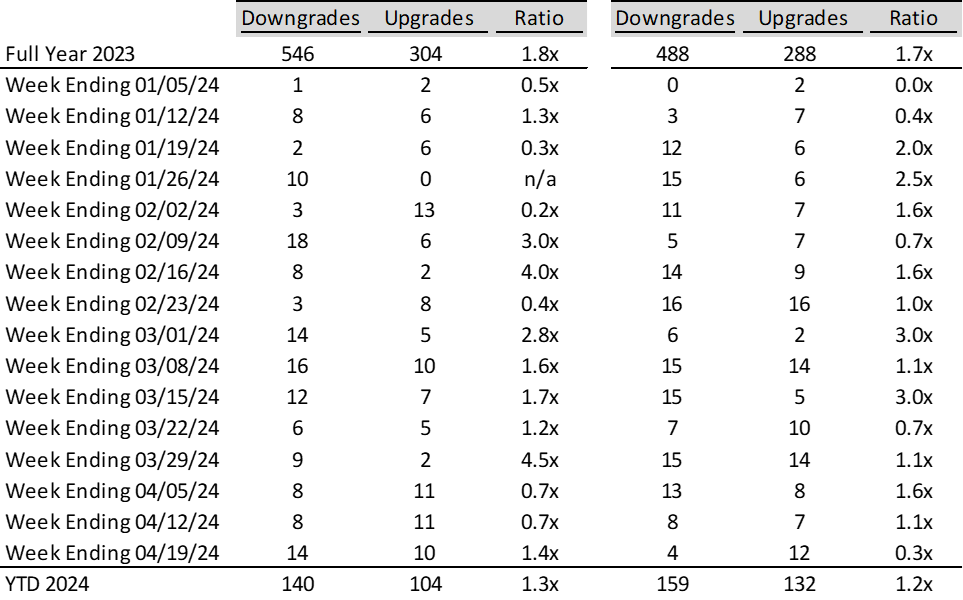
Ratings activity:
- S&P and Moody’s High Yield Ratings
Appendix:
Diagram A: Leveraged Loan Trading Levels
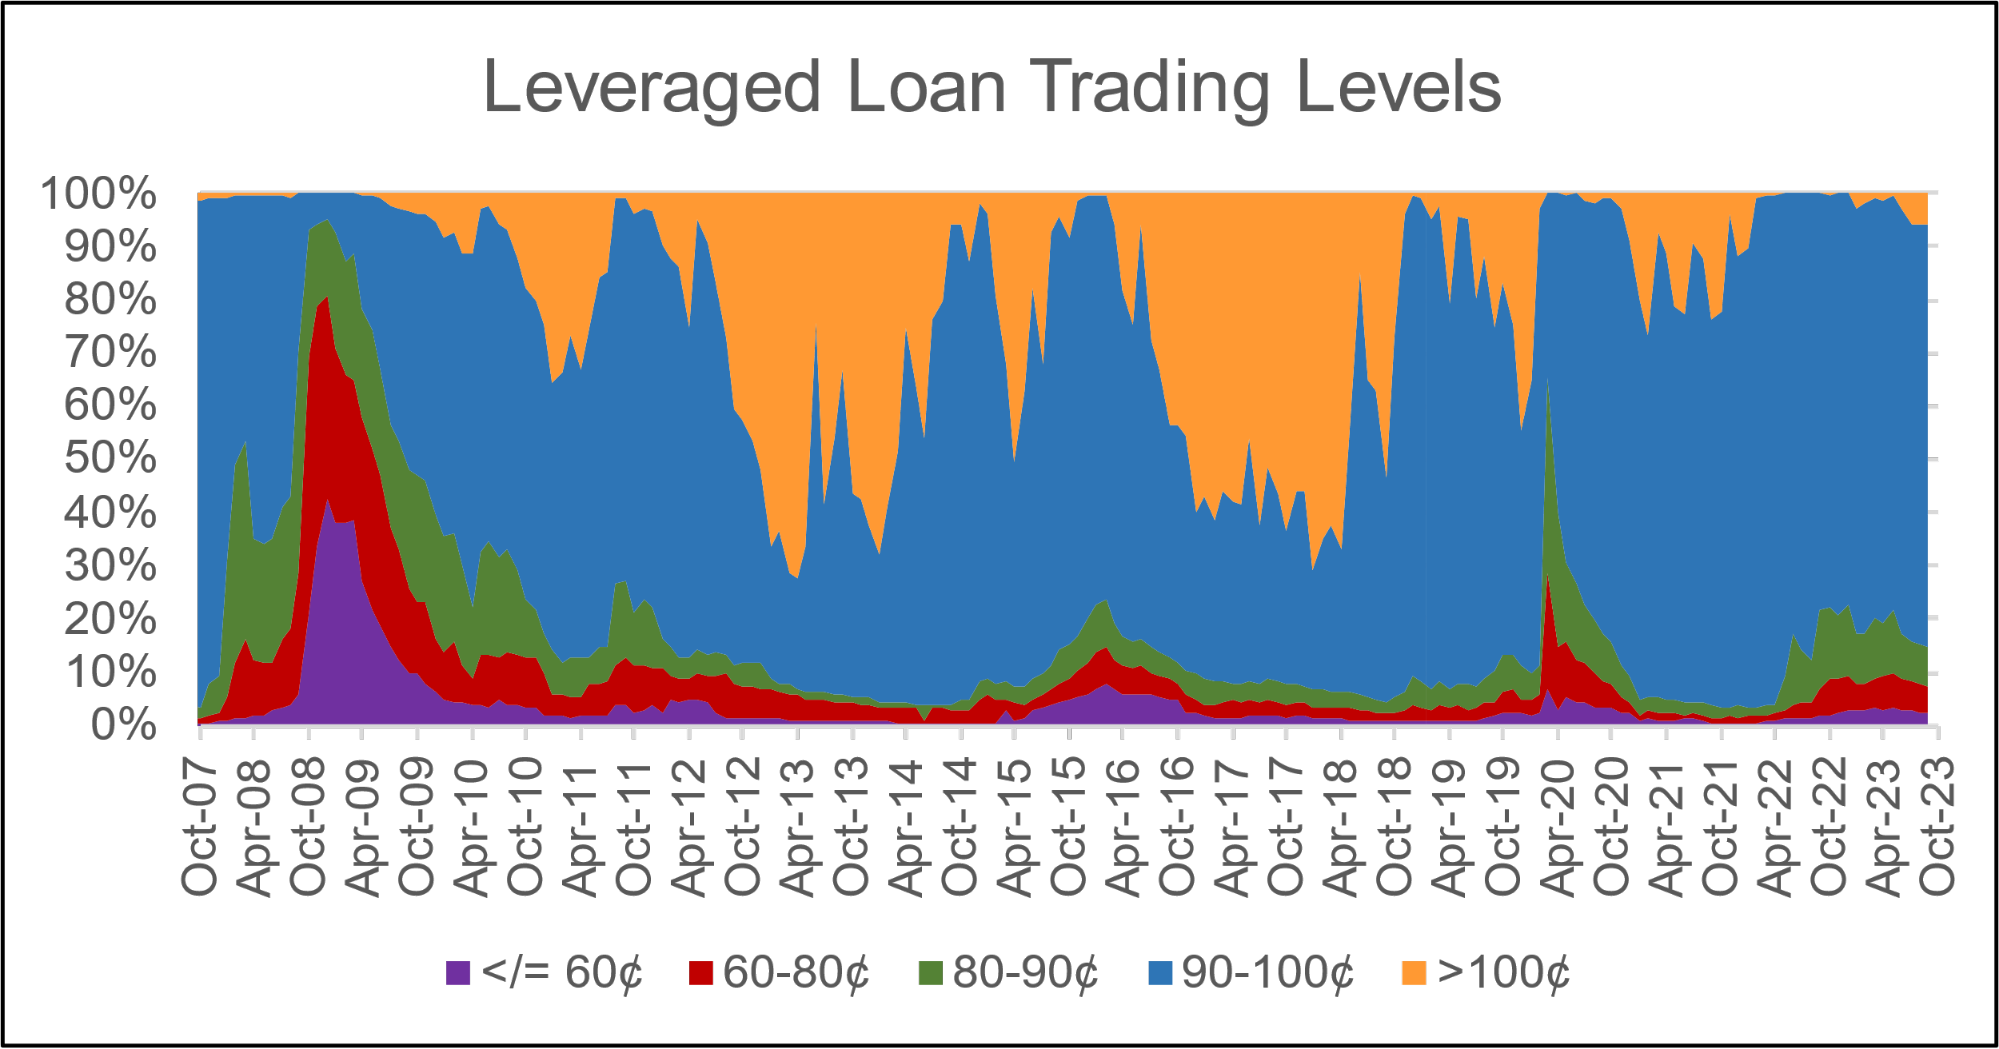
Source: Credit Suisse Leveraged Loan Index
Diagram B: High Yield and Leveraged Loan LTM Price
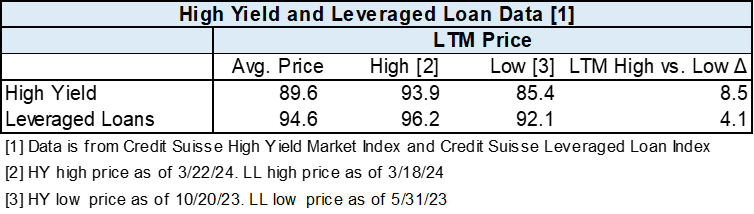
Diagram C: Leveraged Loan and High Yield Returns
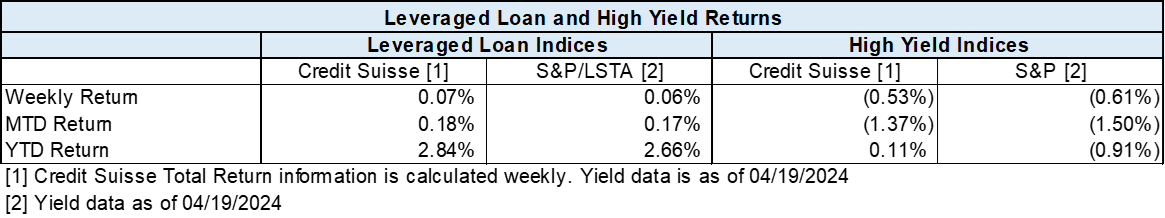
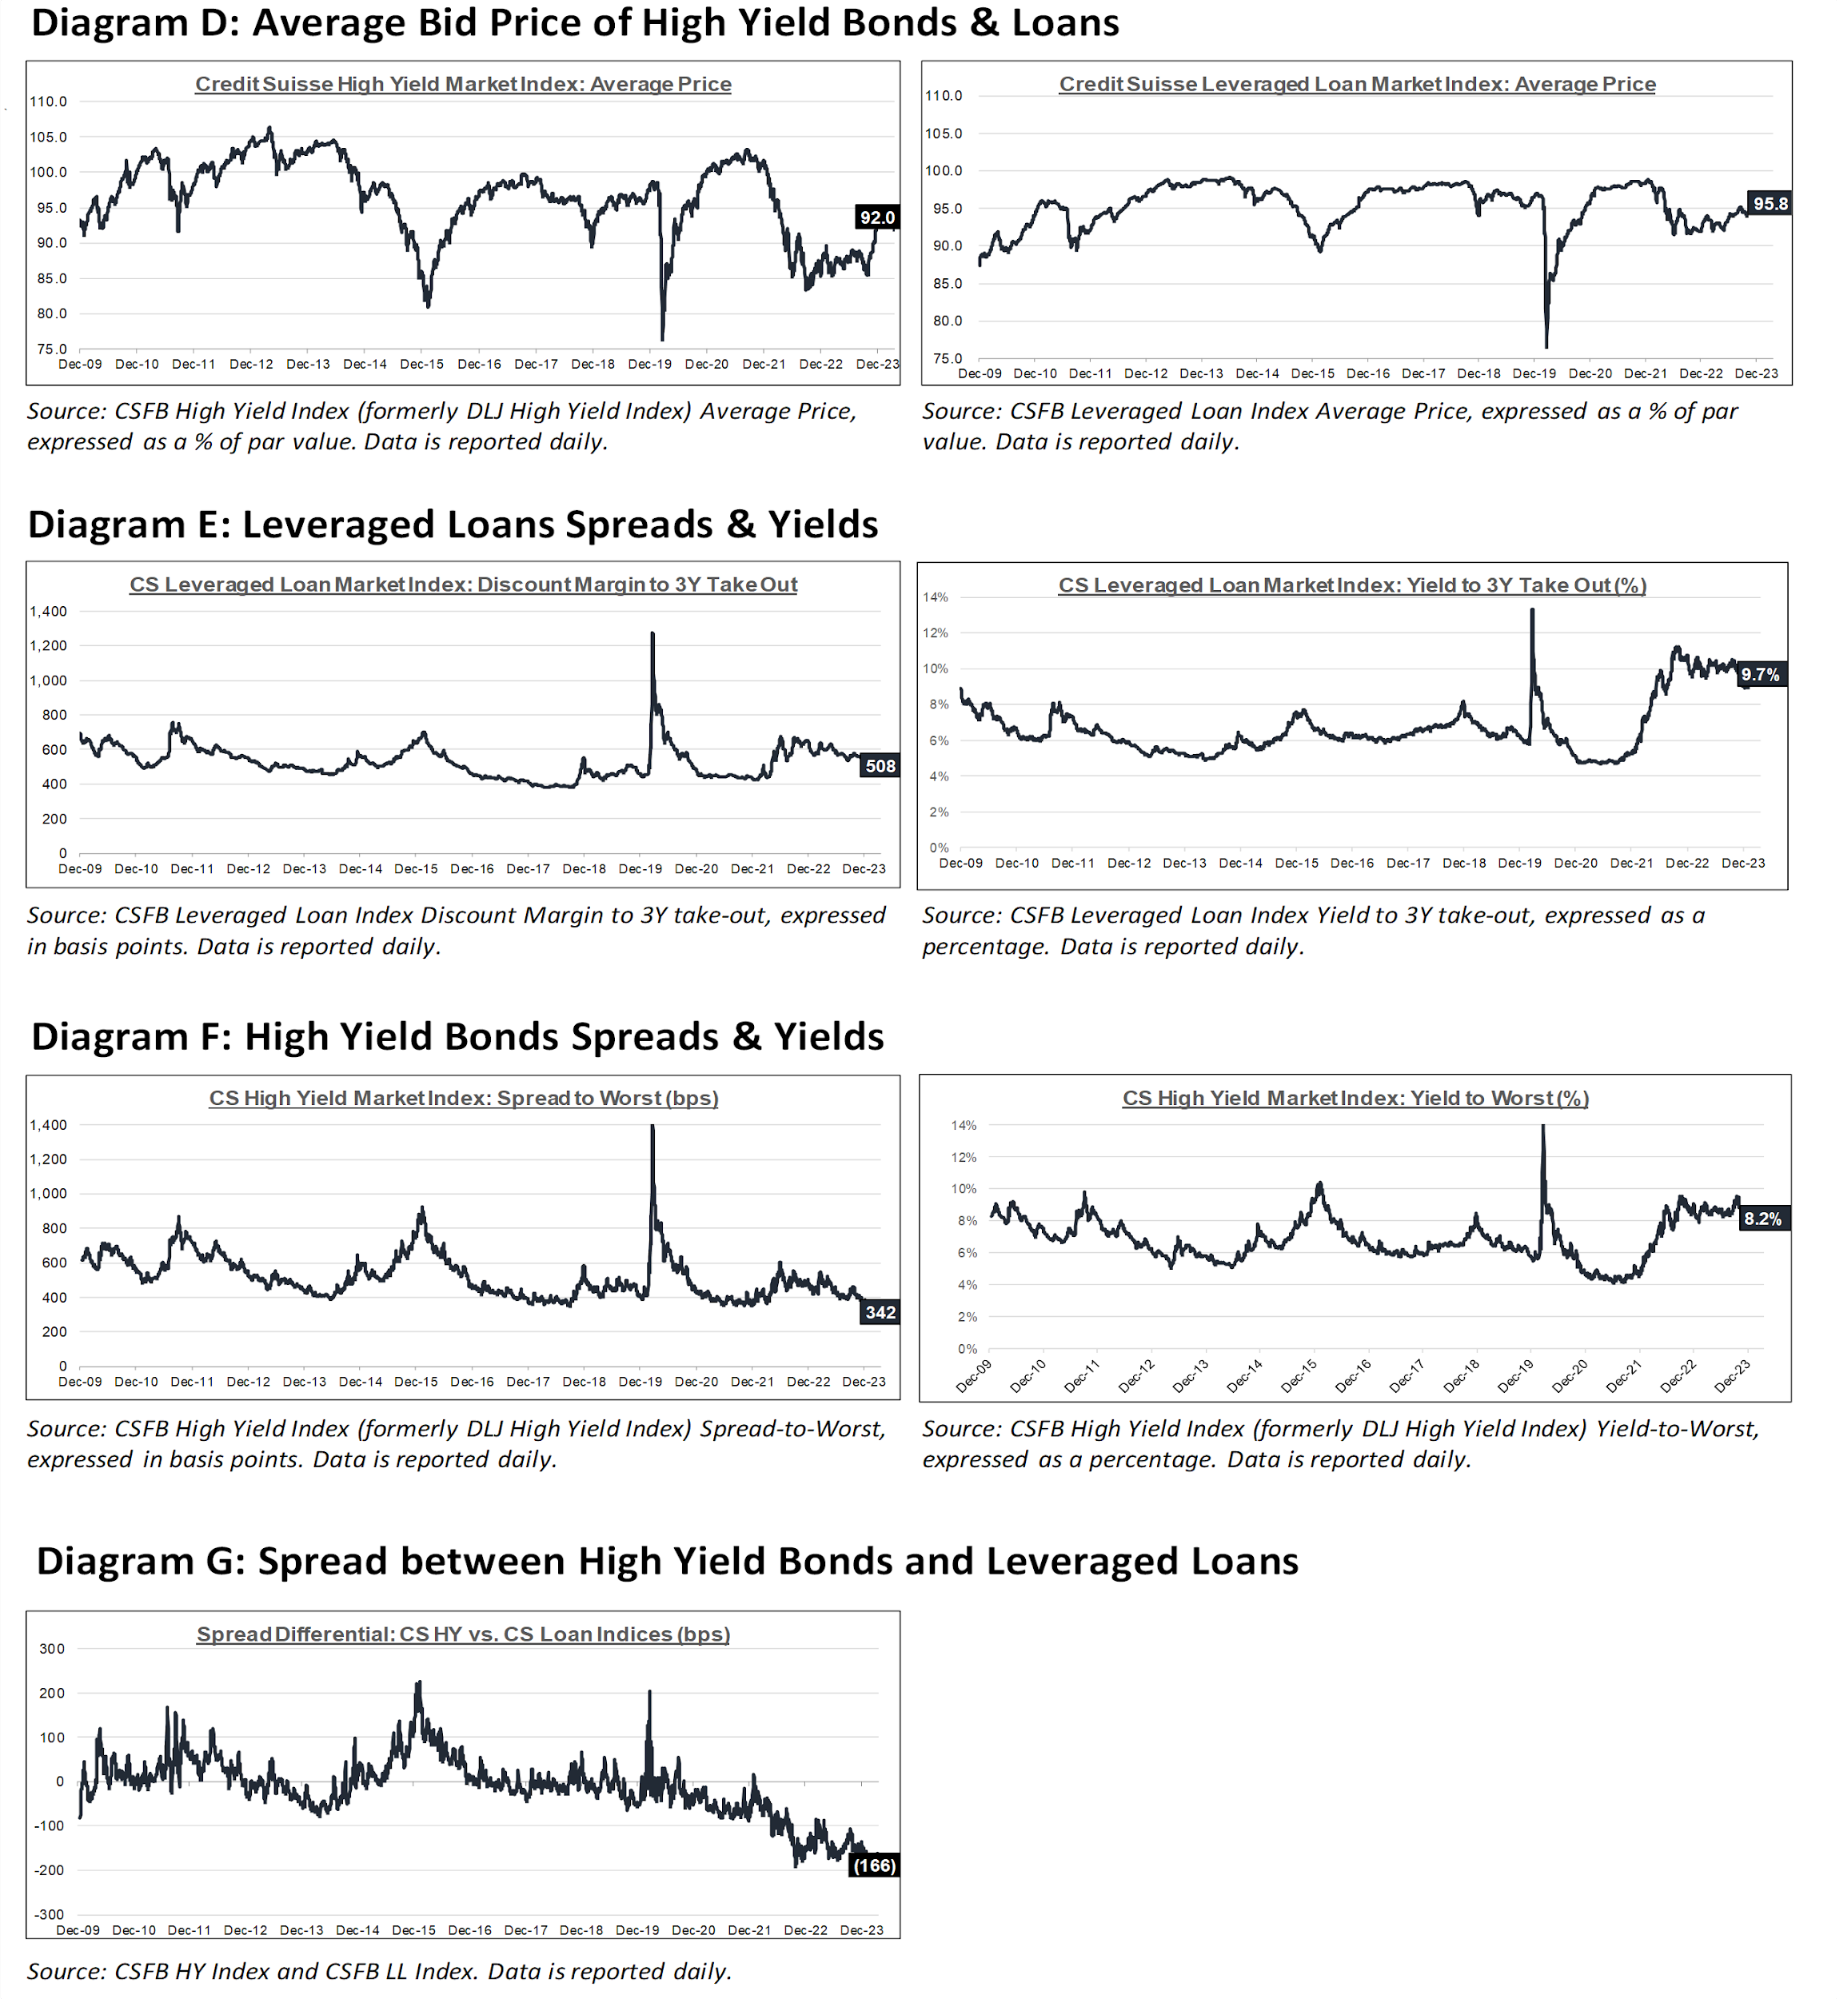
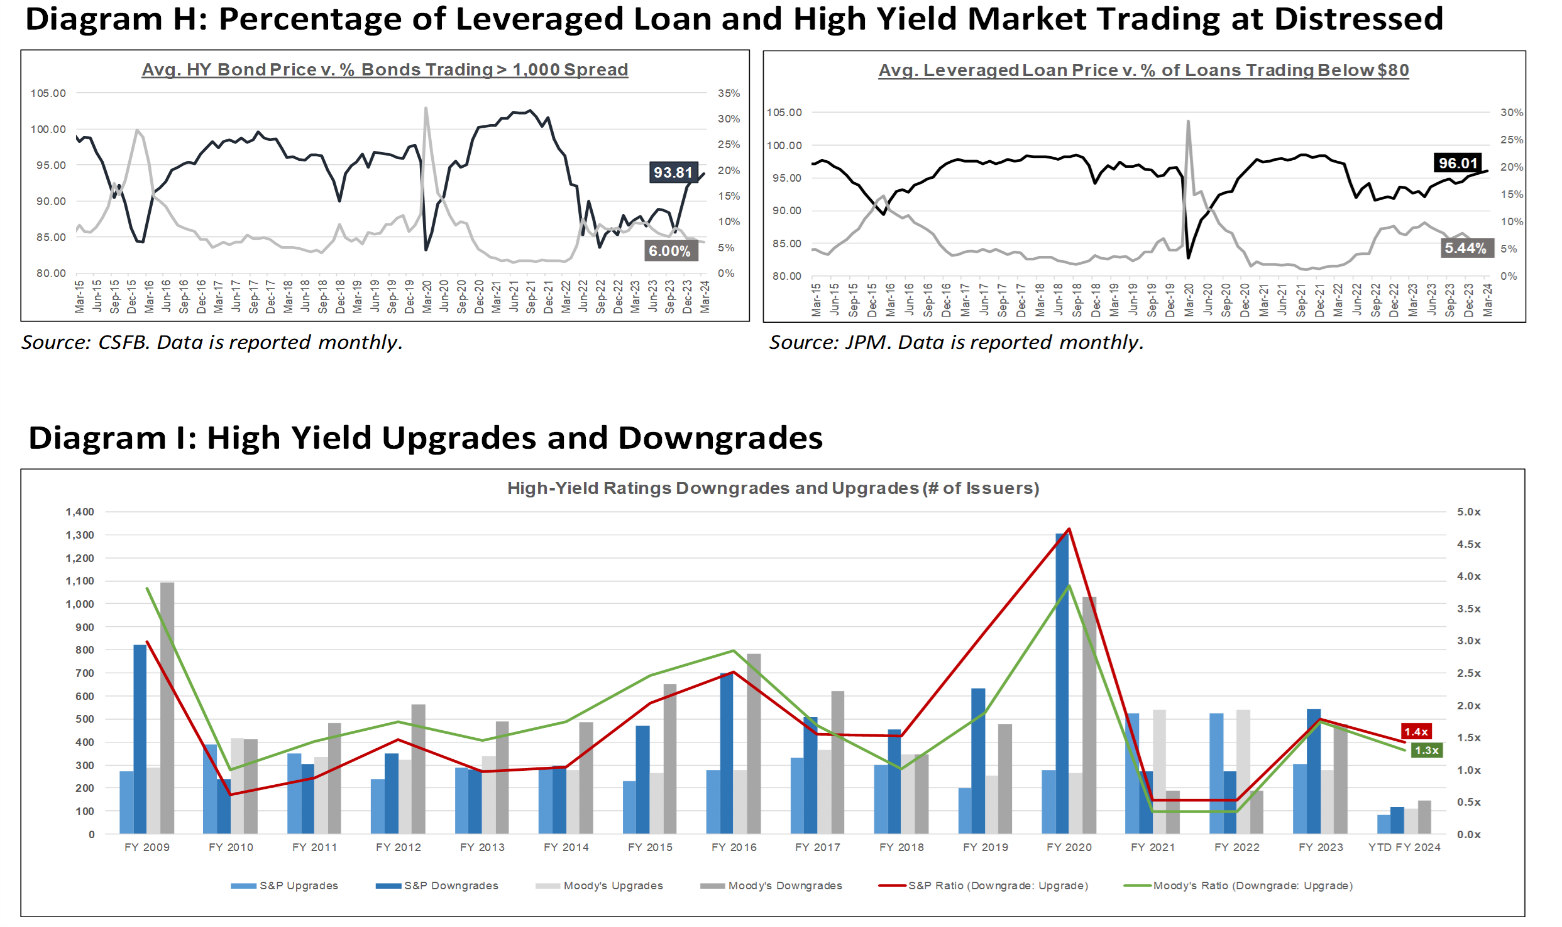
Diagram J: Leveraged Loan Defaults by Sector – Full Year
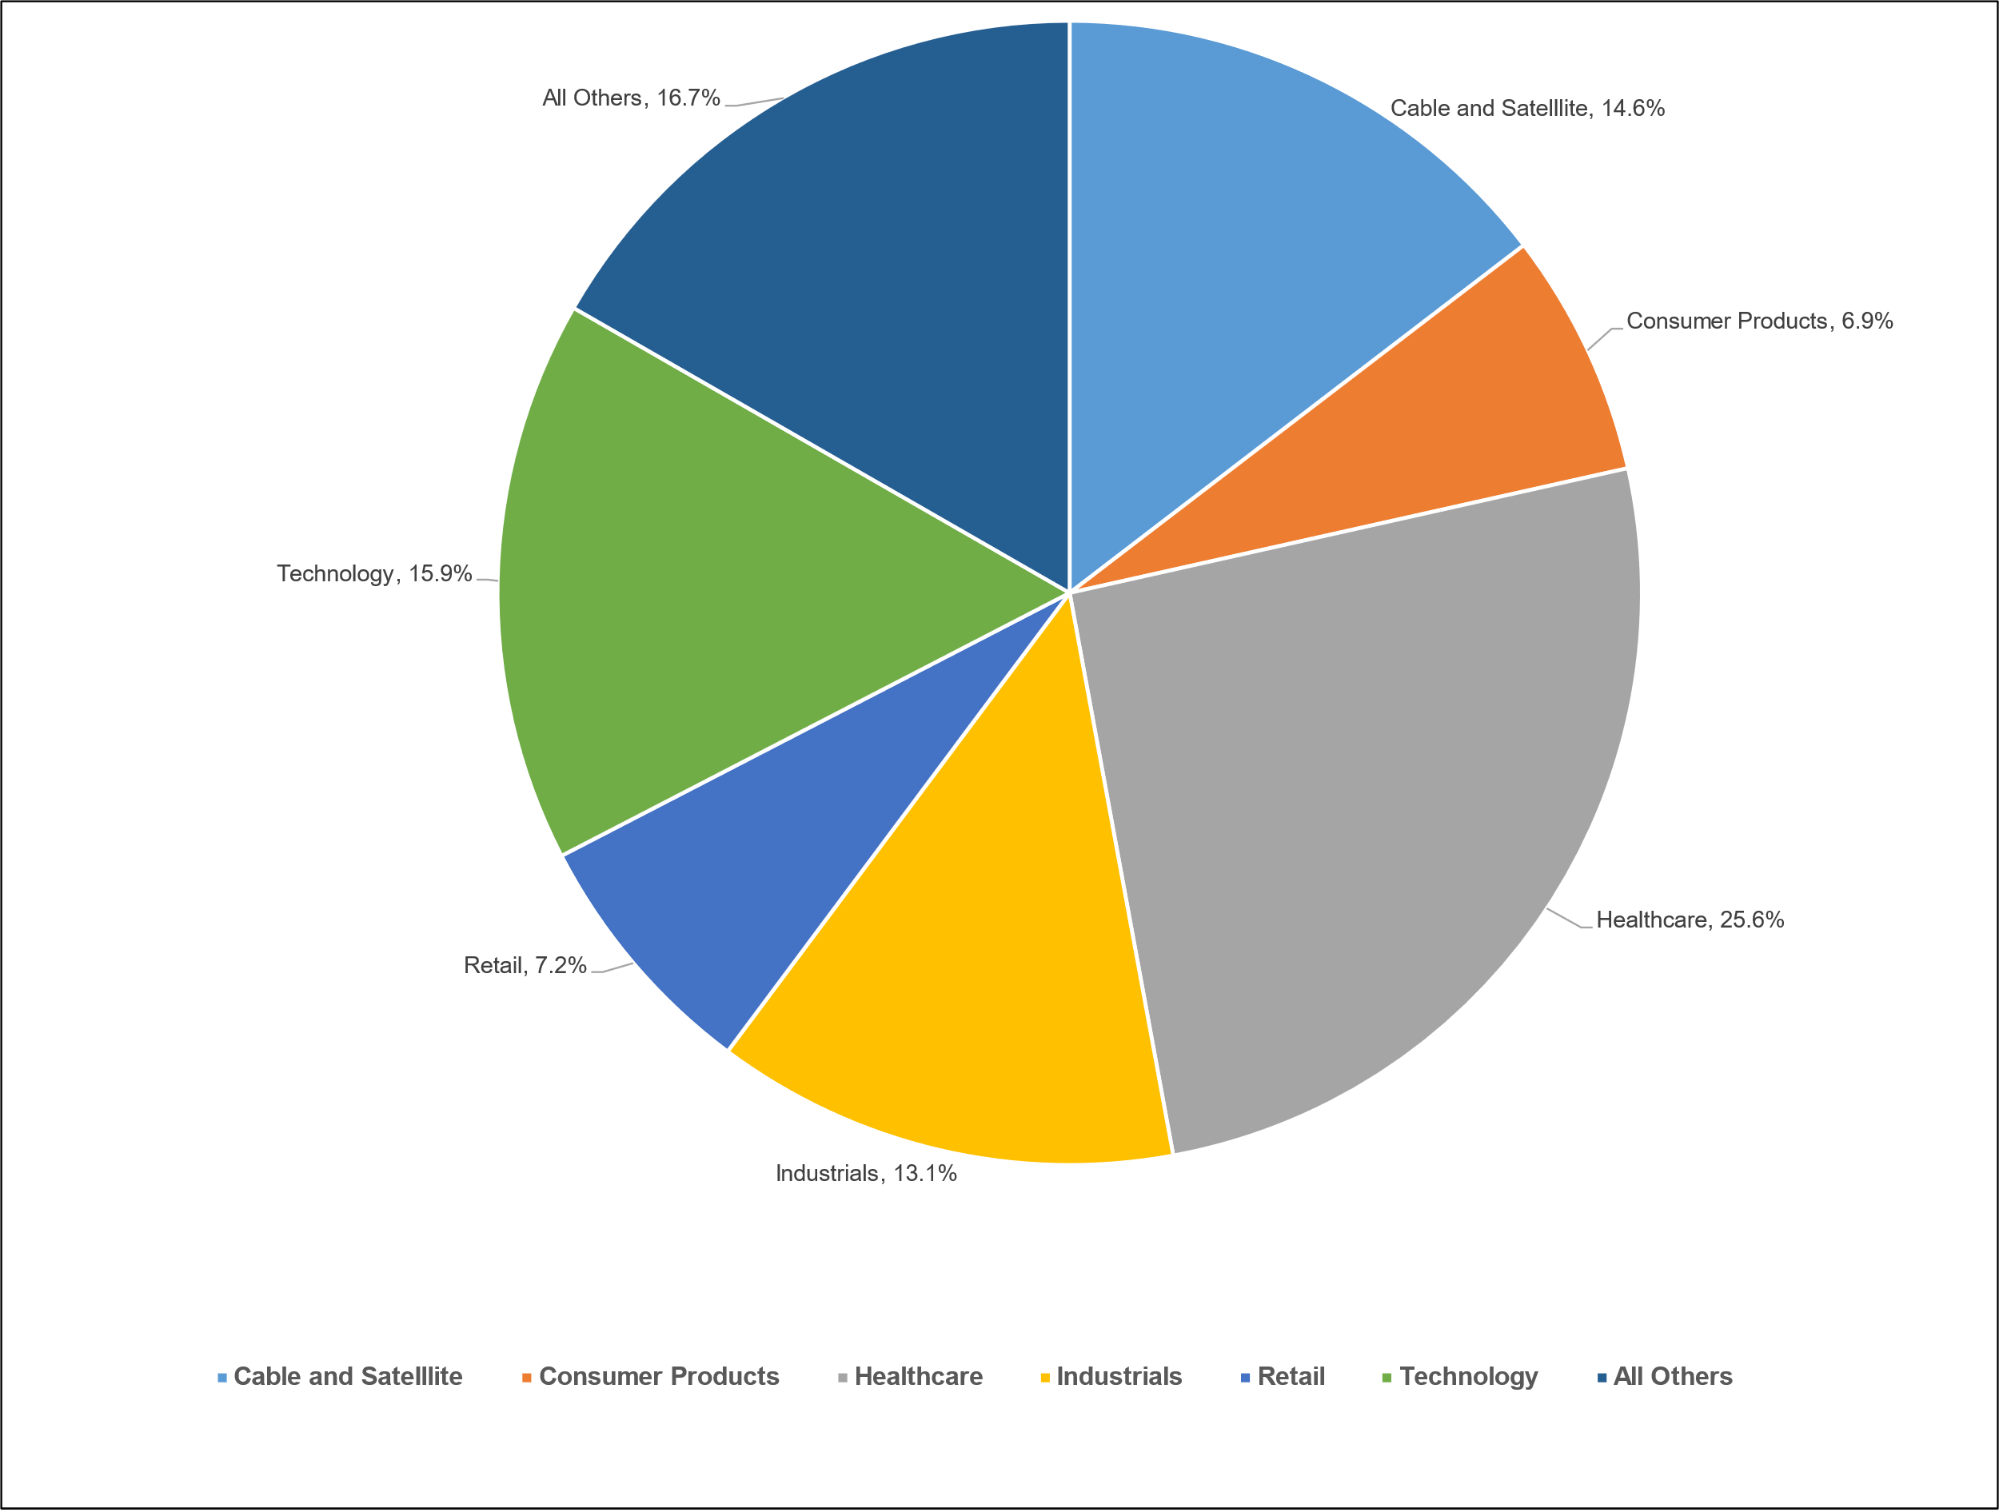
Diagram L: CLO Economics
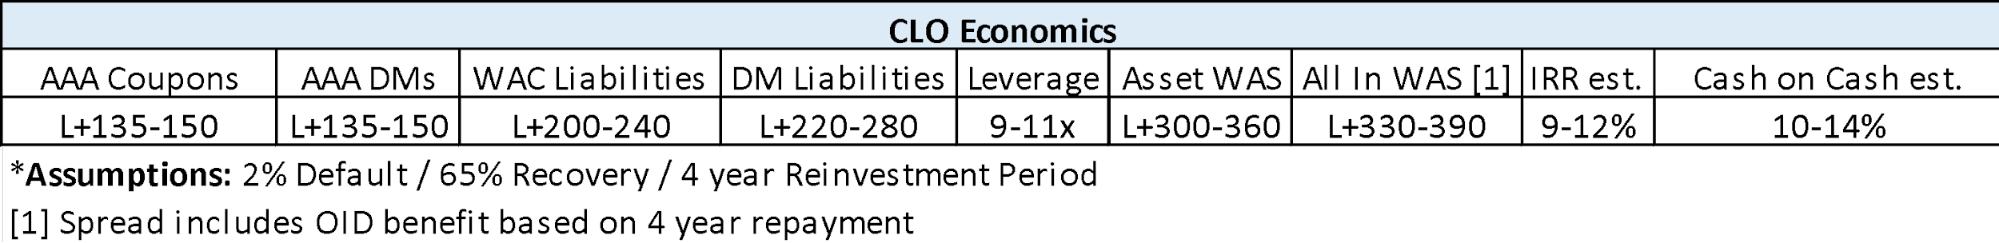
Diagram N: Developed Country GovBond Yields (%)
Diagram O: S&P 500 Historical Multiples
Diagram P: U.S. Middle-Market M&A Valuations (EV/EBITDA)
Diagram Q: U.S. Large Cap M&A Valuations (EV/EBITDA
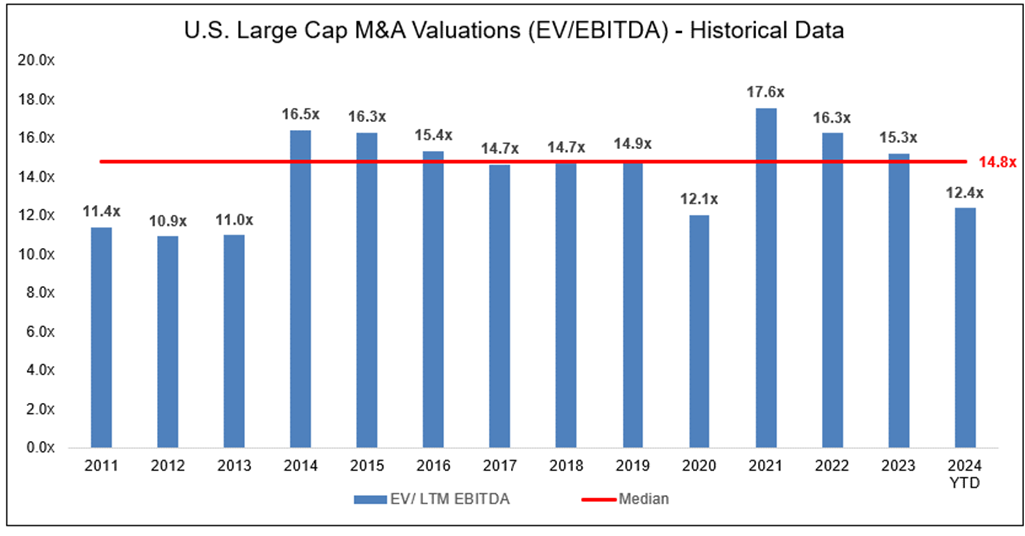
Diagram R: Dry Powder for All Private Equity Buyouts
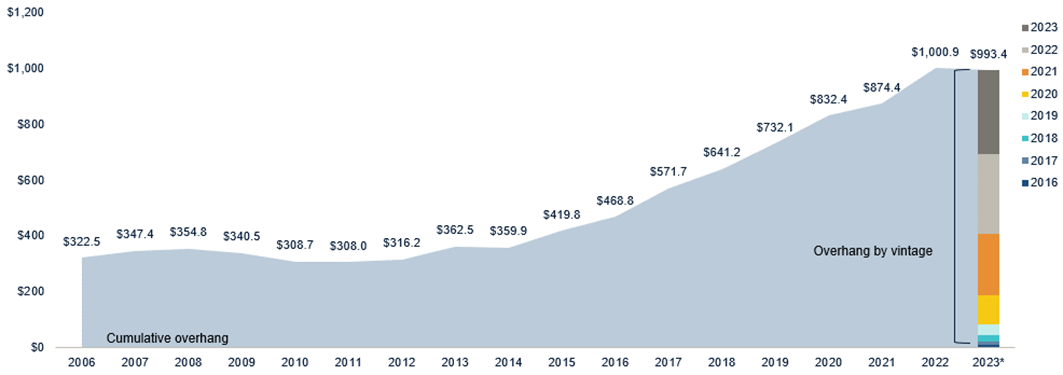
Diagram S: Structured Credit Spreads
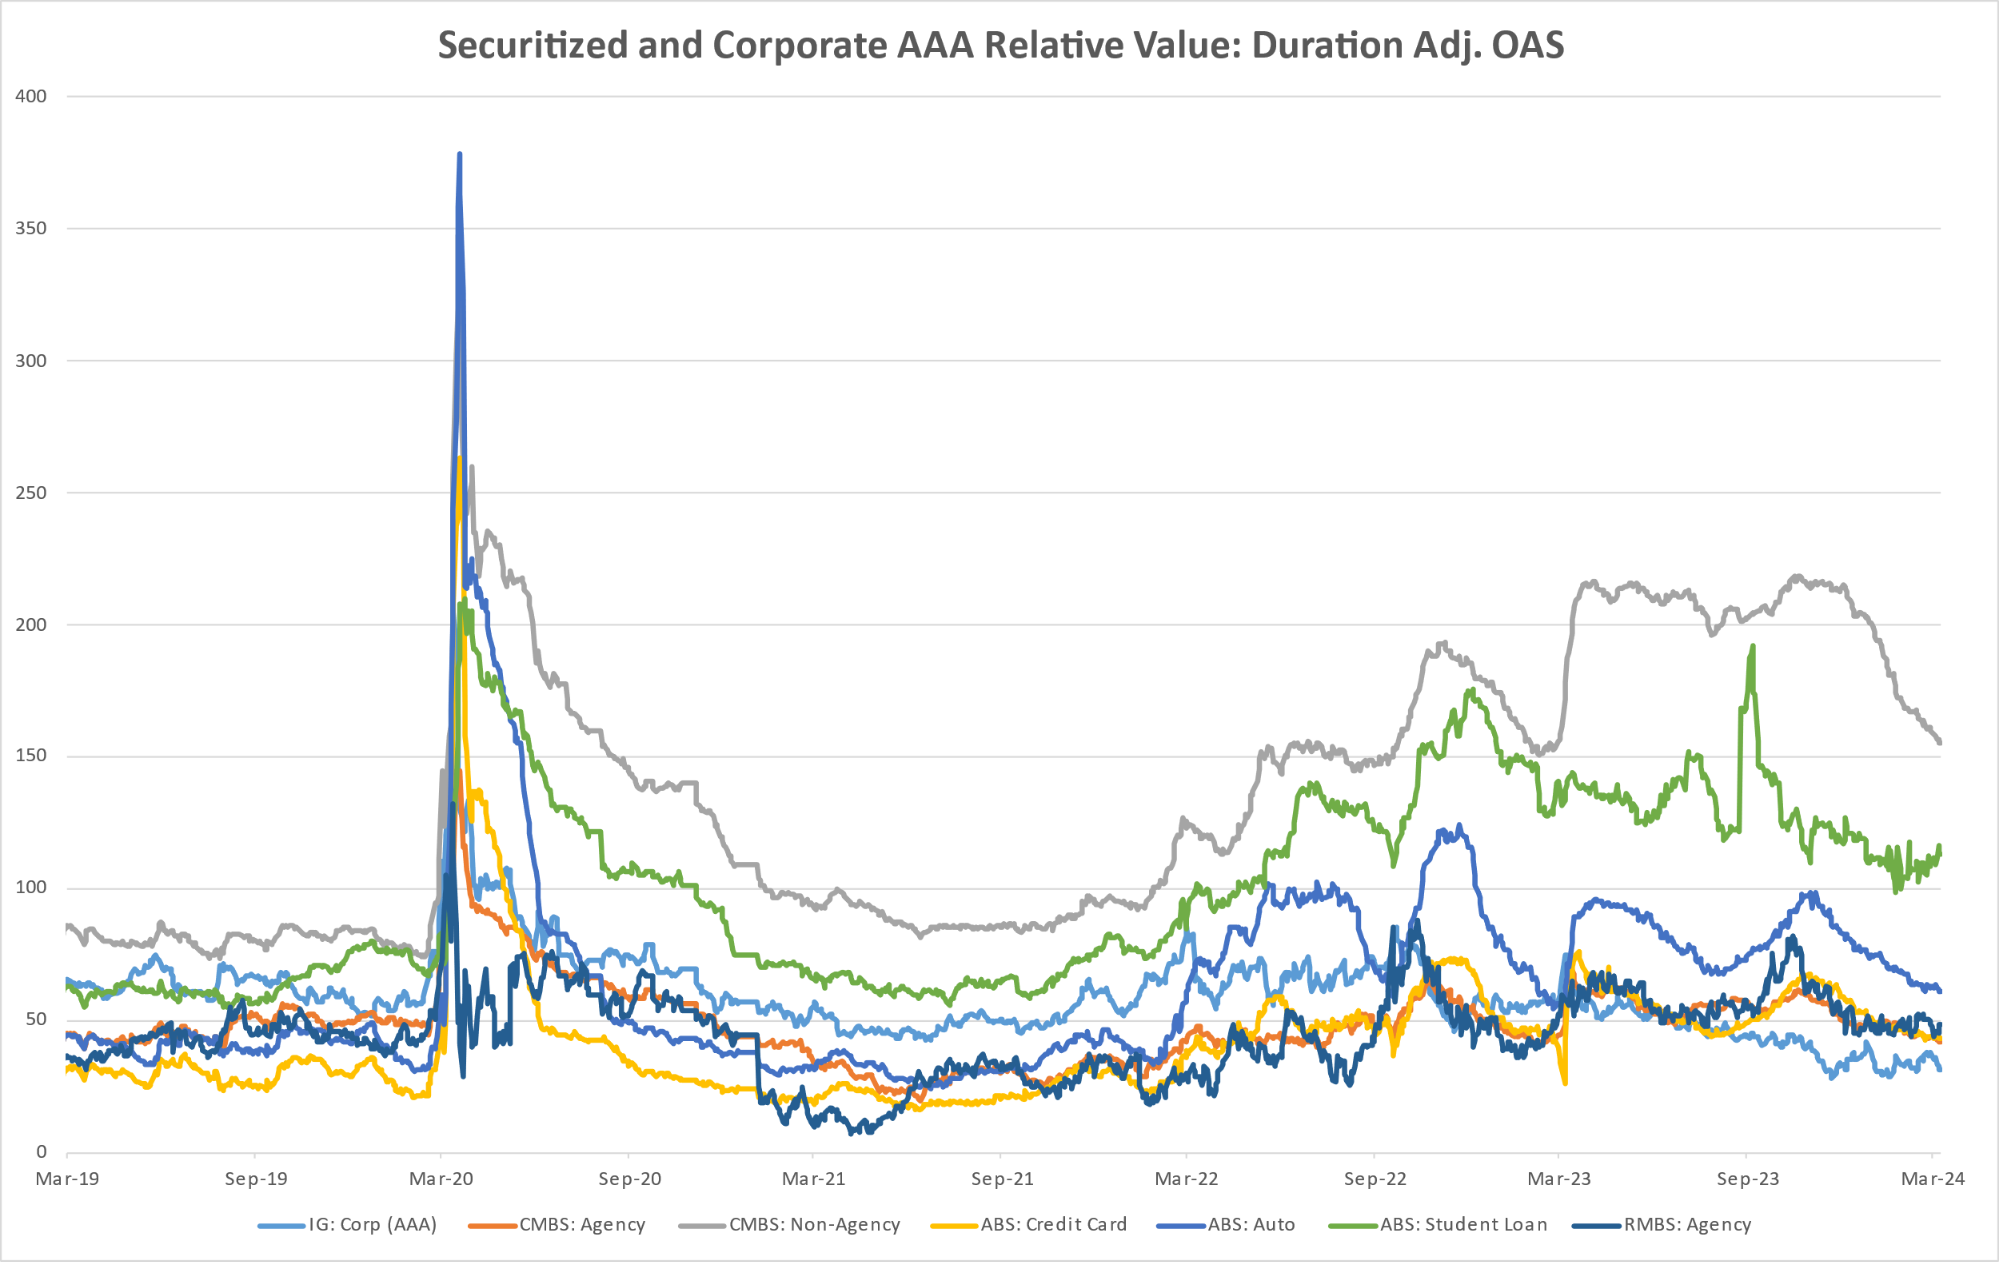
Diagram T: Structured Credit Yield
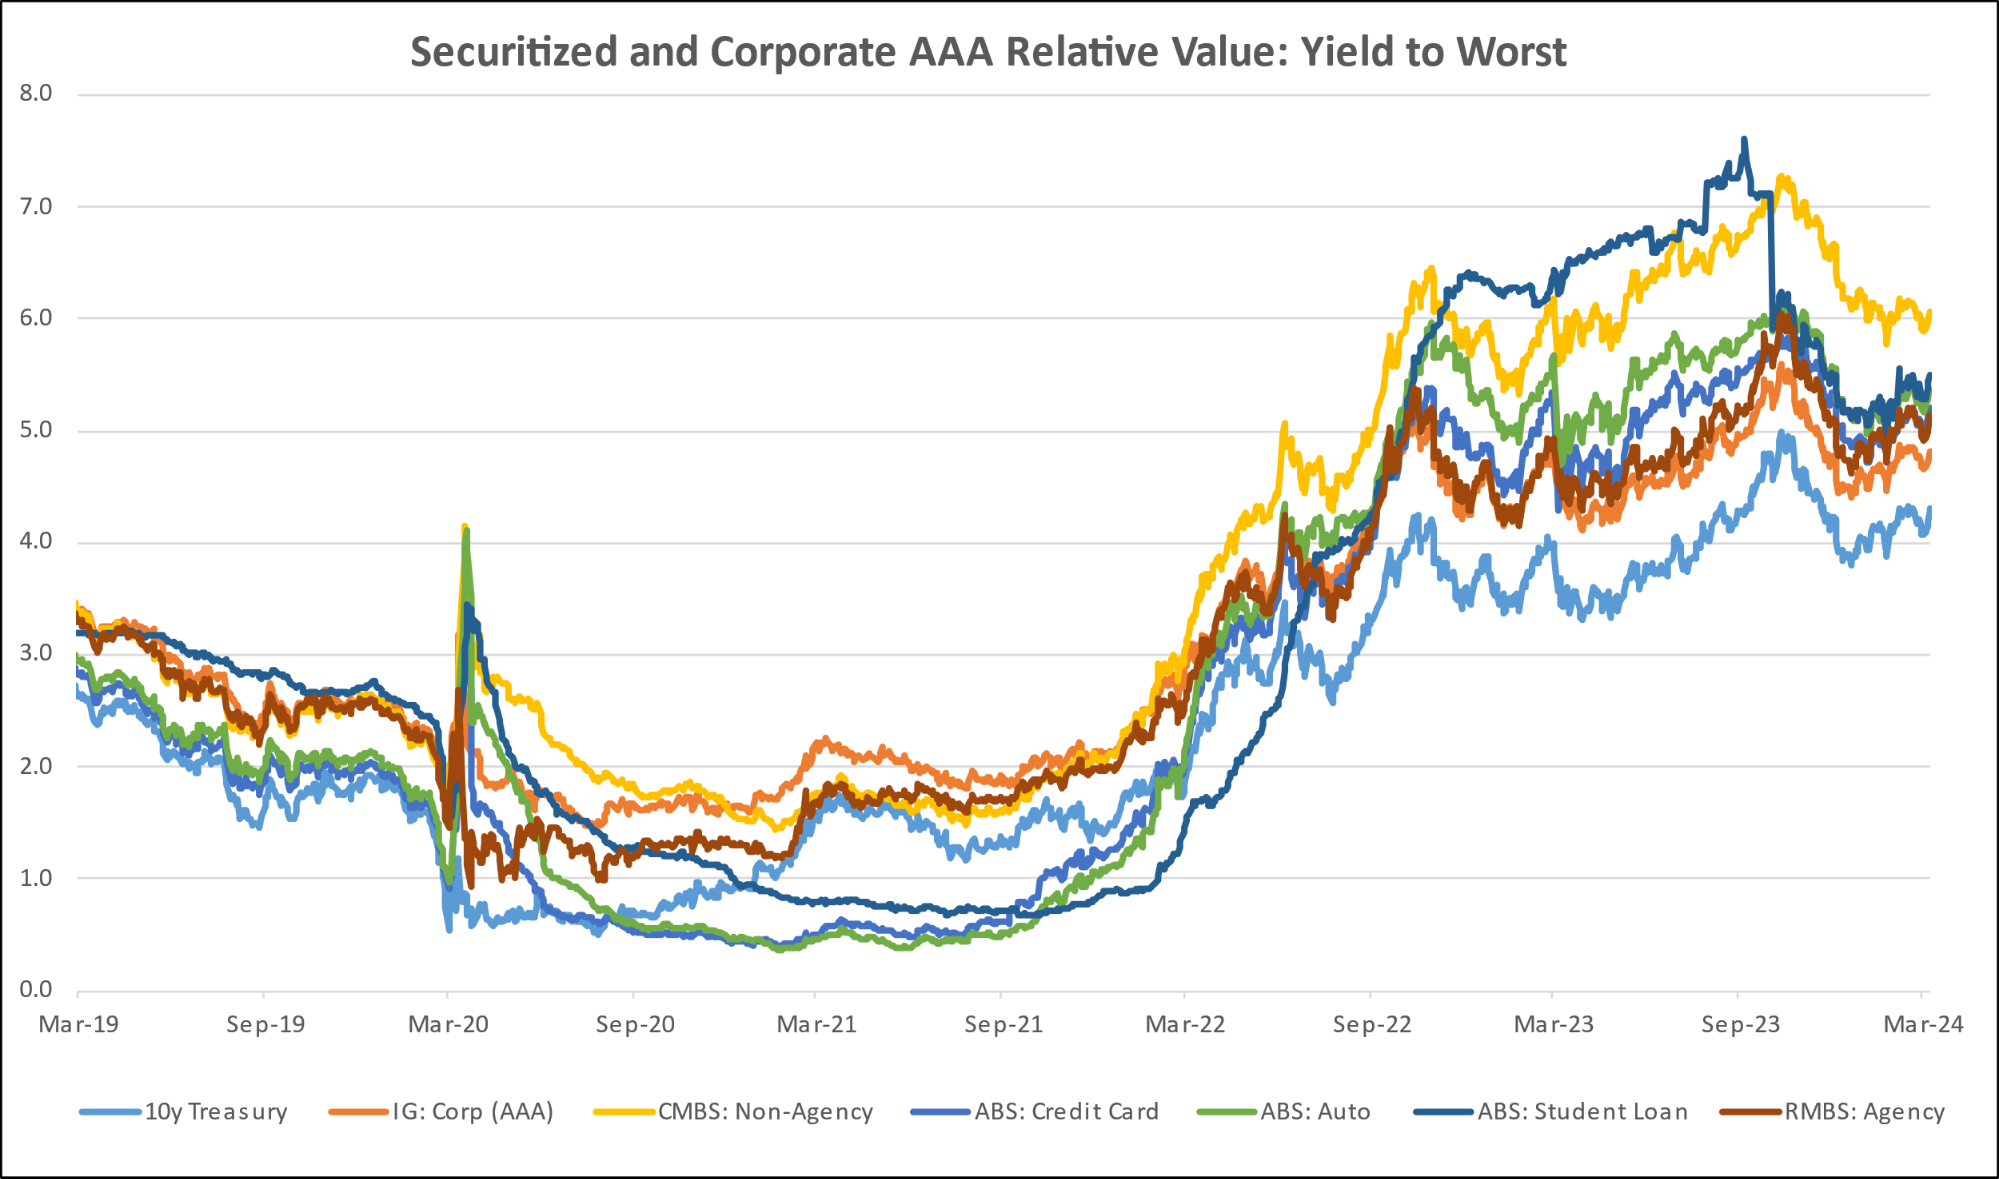
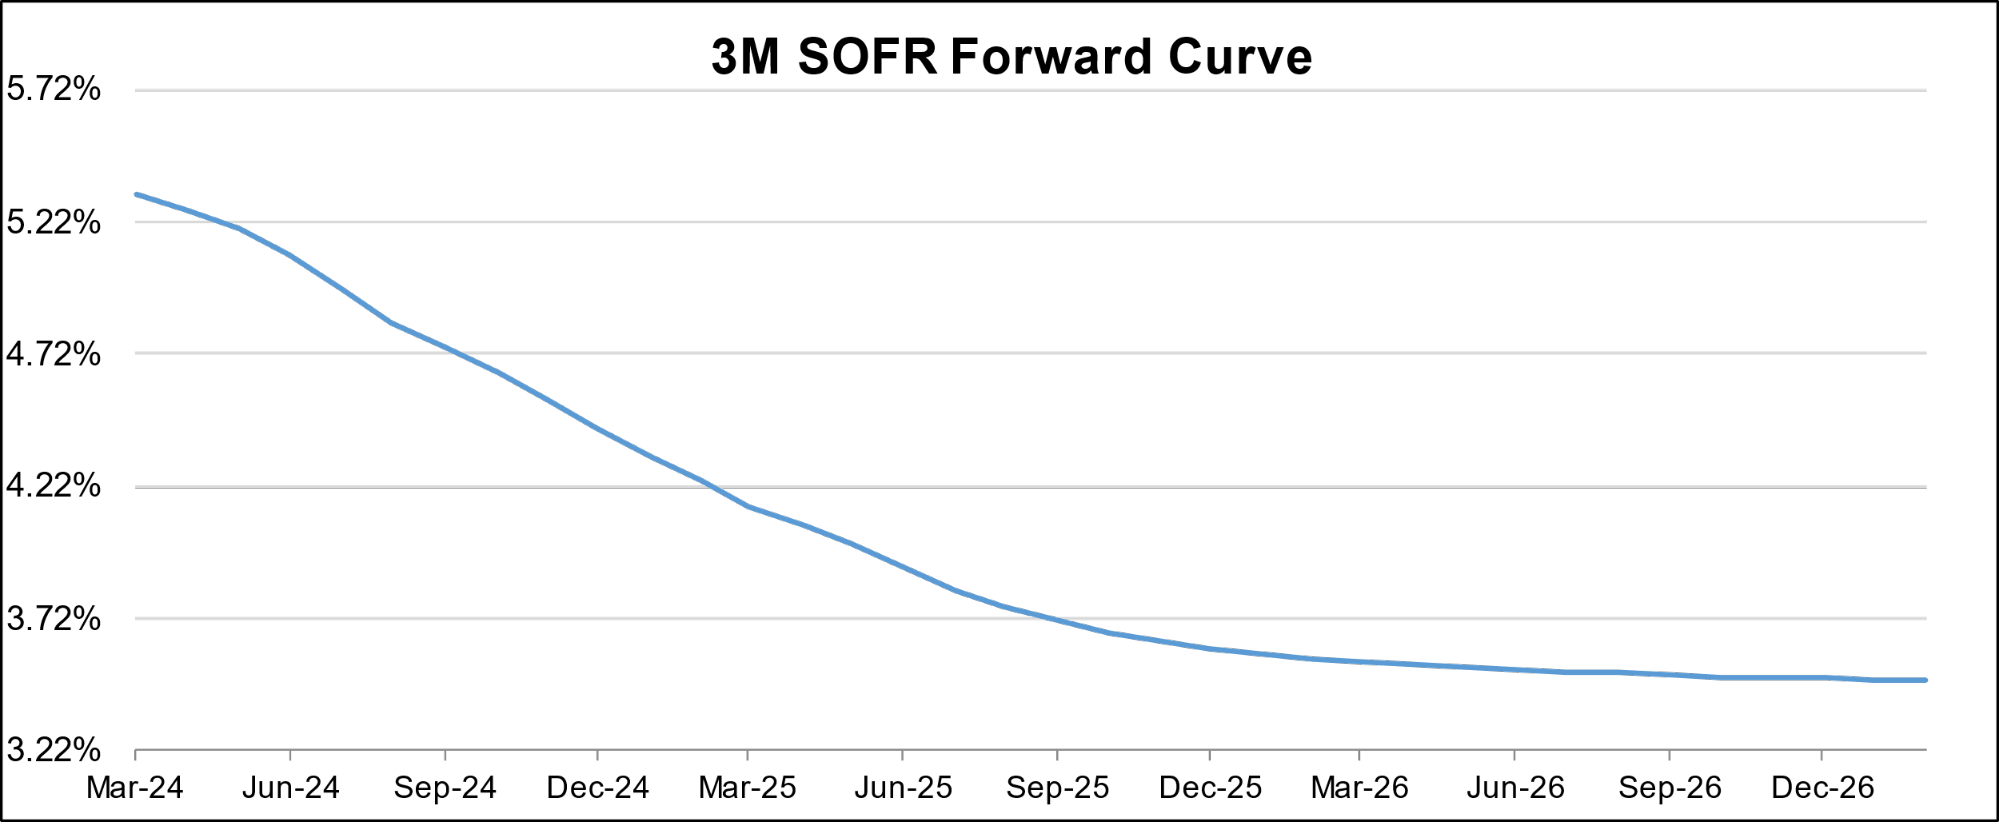
Diagram U: SOFR CURVE
Freight Rates
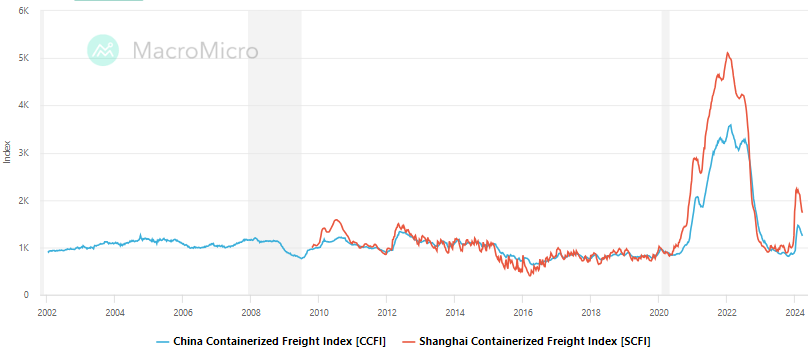
Drewry World Container Index
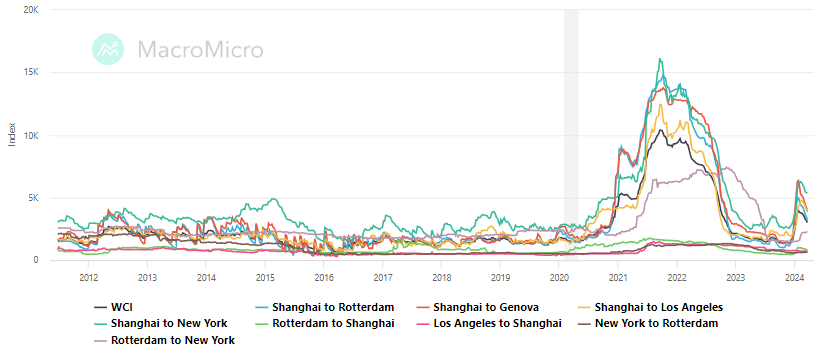
China-Global & Shanghai Export Container Freight Index
ZCGC RE Research:
30-Year Fixed Rate Mortgage: 7.10%
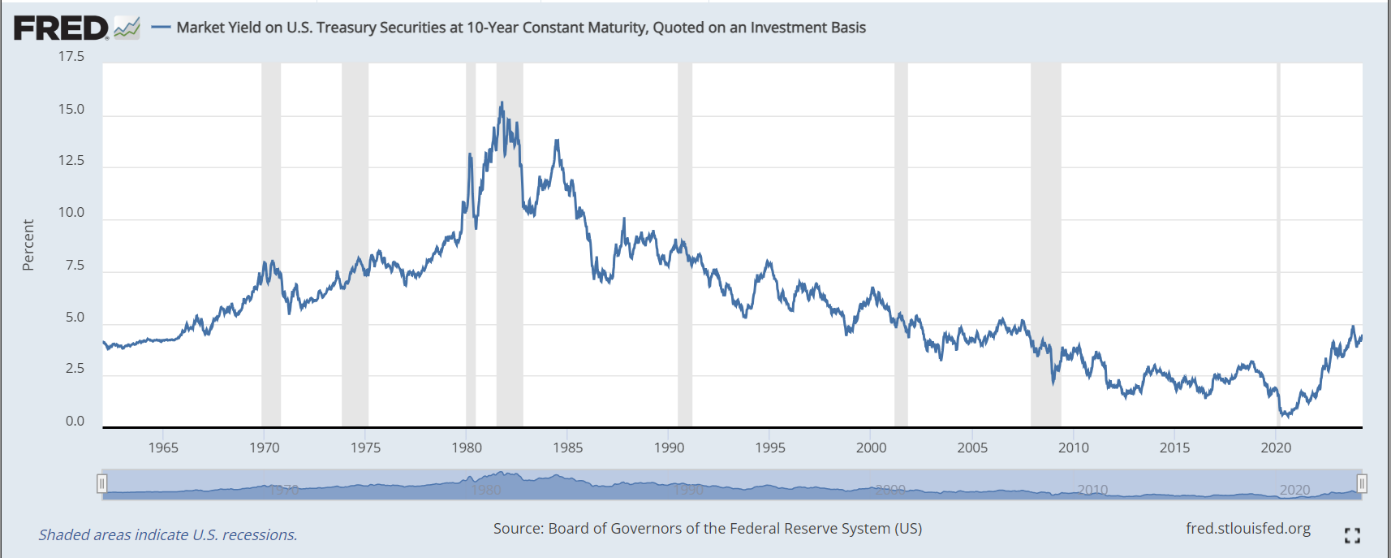
10-Year Treasury: 4.48%
U.S. News
- U.S. Retail Sales
- Sales at retailers rose 0.7% in March after economists forecasted a smaller 0.3% increase
- Sales minus auto and gas rose 1.0%
- Internet retail sales rose 2.7%, with online retailers benefiting from the Easter holiday falling in March this year
- Existing Home Sales
- Existing home sales fell 4.3% to an annual rate of 4.19 million in March
- The median sales price was $393,500 in March, down from its peak at $413,800 in June of 2022
- The dip in sales is primarily due to the average rate of the 30-year mortgage jumping a quarter percentage point to 7.1%. Additionally, home buyers are confused about the coming changes to how real estate agents are compensated
- Housing Starts
- Construction of new homes fell 14.7% in March as home builders scaled back new projects
- Housing starts fell to a 1.32 million annual pase from a 1.55 million pace in February
- The drop in March was the sharpest since April 2020, when starts dropped by 27%
- Jobless Claims
- Initial jobless claims, a measure of how many workers were laid off across the U.S., decreased to 212,000 in the week ended April 12, down 12,000 from the prior week
- The four-week moving average was 214,500, down 8500 from the prior week
- Continuing claims – those filed by workers unemployed for longer than a week – increased by 2,000 to 1.812 million in the week ended April 5. This figure is reported with a one-week lag
- Fed’s Balance Sheet
- The Federal Reserve’s assets totaled $7.406 trillion in the week ended April 19, down $32.7 billion from the prior week
- Treasury holdings totaled $4.560 trillion, down $15.3 billion from the prior week
- Holdings of mortgage-backed securities (MBS) were $2.39 trillion in the week, down $0.2 billion from the prior week
- Total Public Debt
- Total public debt outstanding was $34.58 trillion as of April 19, an increase of 9.9% from the previous year
- Debt held by the public was $24.63 trillion, and intragovernmental holdings were $7.08 trillion
- Inflation Factors
- CPI:
- The consumer-price index rose 3.5% in March year over year
- On a monthly basis, the CPI increased 0.4% in March on a seasonally adjusted basis, after increasing 0.4% in February
- The index for all items less food and energy (core CPI) rose 0.4% in March, after rising 0.4% in February
- Core CPI increased 3.8% for the 12 months ending March
- Food and Beverages:
- The food at home index increased 1.2% in March from the same month a year earlier, and decreased 0.0% in March month over month
- The food away from home index increased 4.2% in March from the same month a year earlier, and increased 0.3% in March month over month
- Commodities:
- The energy commodities index increased 1.5% in March after increasing 3.6%
- The energy commodities index fell 0.9% over the last 12 months
- The energy services index (0.0%) in March after increasing 0.1% in February
- The energy services index rose 3.1% over the last 12 months
- The gasoline index fell 1.3% over the last 12 months
- The fuel oil index fell (3.7%) over the last 12 months
- The index for electricity rose 5.0% over the last 12 months
- The index for natural gas fell (3.2%) over the last 12 months
- Supply Chain:
- Drewry’s composite World Container Index decreased to $2,718.54 per 40ft
- Drewry’s composite World Container Index has increased by 53.3% over the last 12 months
- Housing Market:
- The shelter index increased 0.4% in March after increasing 0.4% in February
- The rent index increased 0.5% in March after increasing 0.4% in February
- The index for lodging away from home increased 5.6% in March after increasing 3.1% in February
- Federal Funds Rate
- The effective Federal Funds Rate is at 5.33%, flat 0.00% year to date
World News
-
Israel
- On Friday, Israel launched a retaliatory strike against Iran after the massive drone and missile attacks on Israel’s territory
- The strike targeted the area around Isfahan in central Iran. The city is where Iran has nuclear facilities and an air base. The move has been seen as a moderate response, and Israel has been under pressure from the U.S. and Europe to calm tensions that the Iran attack would grow into a bigger regional conflict
- Iran state television played down the strike on its broadcasts, a move seen as an effort to calm tensions
-
China
- China added a 43.5% tax on imports from the U.S. for U.S. made propionic acid after an investigation revealed that the chemical was sold in China at rock-bottom prices and hurting Chinese producers. The two U.S. companies accused of the low pricing are Dow and Eastman Chemical
- The tariff comes just days after President Biden called for higher tariffs on Chinese steel and the U.S. began anti-dumping problems centered on China’s shipbuilding, maritime and logistics industries. China has an excess supply of unsold metal as a result of China’s property bust
- China is ordering Apple to remove WhatsApp and Threads from the Apple store due to national security concerns, which is the latest example of censorship in the country
-
India
- Incumbent Prime Minister Modi is vying for a third term in office this spring. Modi has been in office since 2014
- The election will last six weeks and be administered by over 15 million poll workers. There are over 960 million people eligible to vote
- Since entering office, Prime Minister Modi’s administration has upgraded the transportation network, built new power plants, and subsidized the construction of 40 million concrete homes
-
Niger
- Niger has ordered the U.S. to withdraw troops and drones from the country, a move that will significantly curtail American strategy to defeat Islamist insurgency in western Africa
-
Italy
- An explosion at a hydroelectric power plant owned by Rome-based energy group Enel killed at least three people. The explosion was likely caused by a fire in a turbine or a transformer at the plant
-
Germany
- Germany’s industrial production rose more than expected in February, helped by a recovery in the construction and car industry, as the country looks to exit a recent manufacturing slump
-
Canada
- Canada’s goods-trade surplus widened more than expected, driven by record gold shipments and marking the strongest export growth in six months
-
South Korea
- South Korea’s exports grew for a sixth consecutive month, driven by strong demand for semiconductors and ships, with a 3.1% increase from the previous year to $56.56 billion
-
Taiwan
- A magnitude-7.4 earthquake, the strongest to hit Taiwan in 25 years, killed at least nine people, injured more than 900, and caused significant structural damage including the collapse of buildings
-
Japan
- The Bank of Japan ended negative interest rates and unwound most of its unconventional monetary easing policies, moving its key target for short-term rates to a range of 0% to 0.1%, its first rate increase since 2007
Commodities
-
Oil Prices
- WTI: $83.14 per barrel
- (2.94%) WoW; +16.04% YTD; +7.57% YoY
- Brent: $87.36 per barrel
- (3.42%) WoW; +13.40% YTD; +7.72% YoY
-
US Production
- U.S. oil production amounted to 13.1 million bpd for the week ended April 12, up 0.8 million bpd
from the prior week
-
Rig Count
- The total number of oil rigs amounted to 619, up 2 from last week
-
Inventories
-
Crude Oil
- Total U.S. crude oil inventories now amount to 460.0 million barrels, down (1.3%) YoY
- Refiners operated at a capacity utilization rate of 88.1% for the week, down from 88.3% in the prior week
- U.S. crude oil imports now amount to 6.434 million barrels per day, down 2.7% YoY
-
Gasoline
- Retail average regular gasoline prices amounted to $3.68 per gallon in the week of April 19,
down (0.1%) YoY
- Gasoline prices on the East Coast amounted to $3.56, down (1.5%) YoY
- Gasoline prices in the Midwest amounted to $3.54, down (3.2%) YoY
- Gasoline prices on the Gulf Coast amounted to $3.27, down (4.6%) YoY
- Gasoline prices in the Rocky Mountain region amounted to $3.55, down (2.7%) YoY
- Gasoline prices on the West Coast amounted to $4.98, up 7.6% YoY
- Motor gasoline inventories were down by 1.2 million barrels from the prior week
- Motor gasoline inventories amounted to 227.4 million barrels, up 1.7% YoY
- Production of motor gasoline averaged 9.42 million bpd, down (0.6%) YoY
- Demand for motor gasoline amounted to 8.662 million bpd, up 1.7% YoY
-
Distillates
- Distillate inventories decreased by -2.8 million in the week of April 19
- Total distillate inventories amounted to 115.0 million barrels, up 2.6% YoY
- Distillate production averaged 4.601 million bpd, down (3.1%) YoY
- Demand for distillates averaged 3.666 million bpd in the week, down (2.6%) YoY
-
Natural Gas
- Natural gas inventories increased by 50 billion cubic feet last week
- Total natural gas inventories now amount to 2,333 billion cubic feet, up 20.9% YoY
Credit News
High yield bond yields increased 20bps to 8.18% and spreads increased 11bps to 342bps. Leveraged loan yields increased 13bps to 9.72% and spreads increased 3bps to 508bps. WTD Leveraged loan returns were positive 7bps. WTD high yield bond returns were negative 53bps. 10yr treasury yields increased 7bps to 4.64%. For the week, yields and spreads rose amid resurfacing geopolitical tensions coupled with the highest VIX since October, steady equity market losses, and higher Treasury yields in response to recalibrated Fed expectations.
High-yield:
Week ended 04/19/2024
- Yields & Spreads1
- Pricing & Returns1
- Fund Flows2
- New Issue2
- Distressed Level (trading in excess of 1,000 bps)2
- Total HY Defaults
1 Source: Credit Suisse High Yield and Leveraged Loan Index
2 Source: JP Morgan
Leveraged loans:
Week ended 04/19/2024
- Yields & Spreads1
- Leveraged Loan Index1
- Fund Flows2
- New Issue2
- Distressed Level (loan price below $80)1
- Total Loan Defaults
Default activity:
- Most recent defaults include: JoAnn Stores ($658mn, 3/18/24), New Insight Holdings ($1.2bn, 3/13/24), Robertshaw ($820mn, 2/29/24), Thrasio LLC ($724mn, 2/28/24), Hornblower ($838mn, 2/20/24), Careismatic ($700mn, 1/22/24), Enviva Partners ($750mn, 1/15/24), Ligado Networks ($4.2bn, 11/1/23), and Air Methods ($1.7bn, 10/24/23).
CLOs:
Week ended 04/19/2024
- New U.S. CLO Issuance2
- New U.S. CLO Issuance2
Note:High-yield and leveraged loan yields and spreads are swap-adjusted
1 Source: Credit Suisse High Yield and Leveraged Loan Index
2 Source: JP Morgan
Ratings activity:
- S&P and Moody’s High Yield Ratings
Appendix:
Diagram A: Leveraged Loan Trading Levels
Source: Credit Suisse Leveraged Loan Index
Diagram B: High Yield and Leveraged Loan LTM Price
Diagram C: Leveraged Loan and High Yield Returns
Diagram J: Leveraged Loan Defaults by Sector – Full Year
Diagram L: CLO Economics
Diagram N: Developed Country GovBond Yields (%)
Diagram O: S&P 500 Historical Multiples
Diagram P: U.S. Middle-Market M&A Valuations (EV/EBITDA)
Diagram Q: U.S. Large Cap M&A Valuations (EV/EBITDA
Diagram R: Dry Powder for All Private Equity Buyouts
Diagram S: Structured Credit Spreads
Diagram T: Structured Credit Yield
Diagram U: SOFR CURVE
Freight Rates
Drewry World Container Index
China-Global & Shanghai Export Container Freight Index
ZCGC RE Research:
30-Year Fixed Rate Mortgage: 7.10%
10-Year Treasury: 4.48%
